Each month we will be publishing on the Koalanda blog a brief report on the Etsy sales of the preceding month. Here is the report for May 2025.
Table of Contents
Sales on Etsy in comparison with previous months
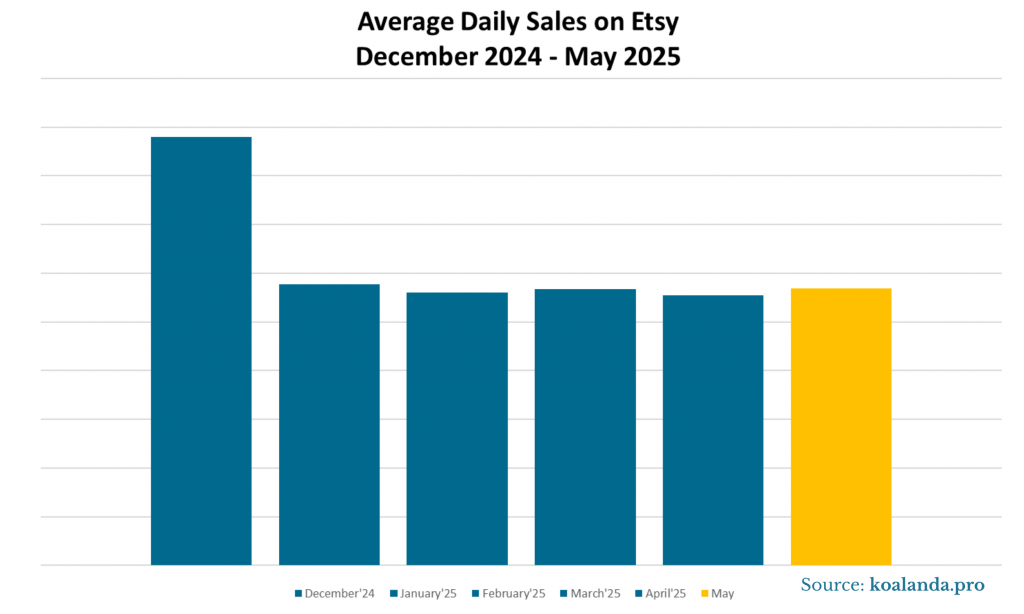
As summer begins, we’re taking a look at Etsy’s sales performance in May. To sum things up briefly—sales were stable, with a slight increase compared to the previous month. Average daily sales in May were 2.6% higher than in April—a modest improvement, but still a step up from the decline we saw last month.

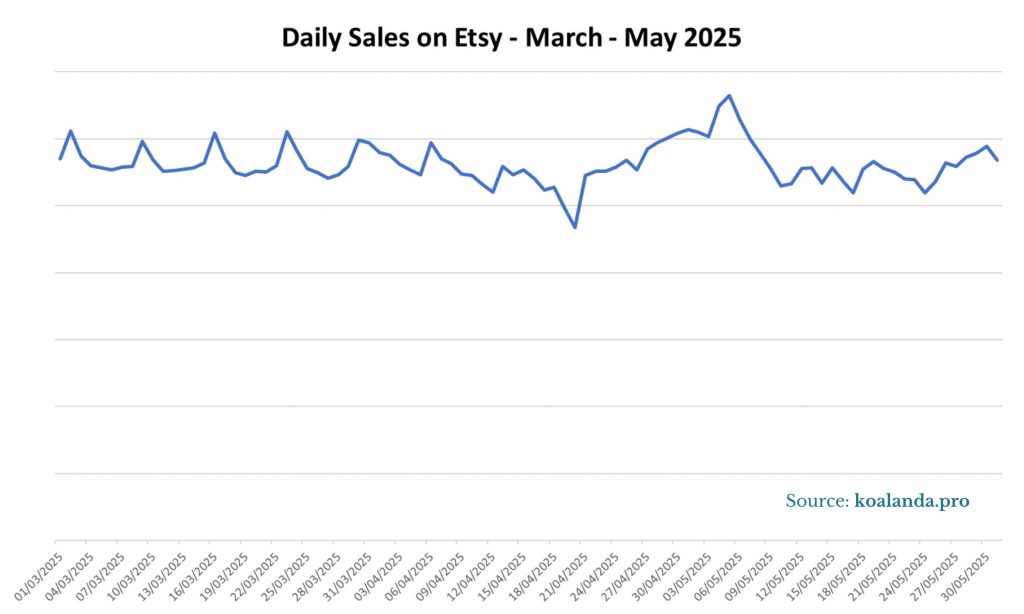
Looking at the daily sales chart for the past three months, it’s clear that May 5th was the strongest day for Etsy sellers during this period. The weakest day came just two weeks earlier, but as we noted in the previous report, that dip was expected and tied to the Easter holiday.

We continue to monitor the numbers with cautious optimism. However, it’s worth noting that the upcoming summer months are unlikely to bring a major boost to overall platform sales. Summer is typically not the strongest season for e-commerce, and Etsy is no exception.
Sales on Etsy by category in May
Let’s take a look at what’s happening across categories.

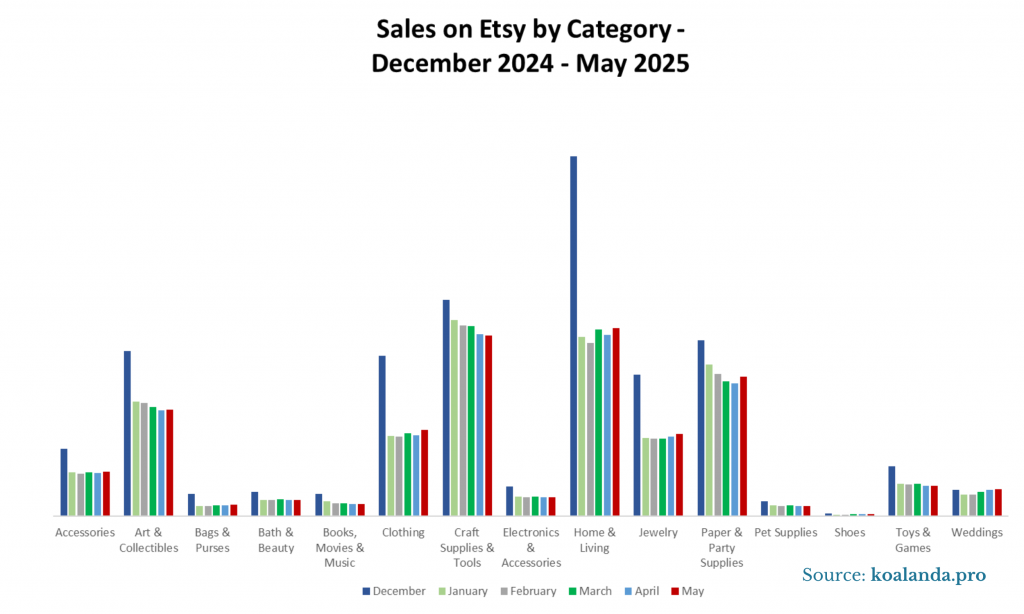
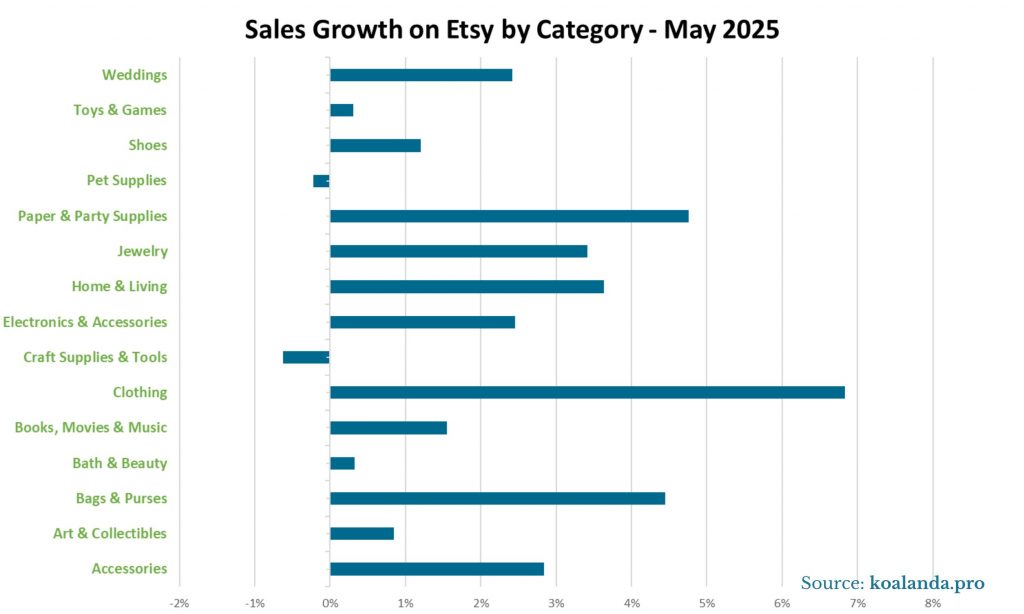
In May, only 2 out of Etsy’s 15 main categories saw a decline in sales compared to April. One of them is Pet Supplies, which has a relatively small share of overall platform sales. The other, however, is one of Etsy’s key categories—Craft Supplies & Tools. This category has always shown slightly different trends from the rest of the platform. For example, its growth during peak periods like Black Friday and Christmas tends to be smaller. That’s not surprising though—many buyers in this category are Etsy sellers themselves, purchasing materials based on business needs rather than seasonal promotions or holiday discounts.

As for the other 13 categories, we’re seeing a range of growth—from very modest increases of less than 0.5% (like in Toys & Games) to nearly 7% in Clothing. Interestingly, Weddings, a category that typically benefits from the start of summer, recorded below-average growth this month. That said, we’re still early in the wedding season, so stronger results may follow in the coming weeks.
It is very useful to compare your results to your competitor shops. With Koalanda’s competitor research tool you can monitor the sales of each individual shop daily! You can see the sales for the last 30 days or 12 months. Analyzing the reasons for their success is a critical step toward improving the quality of your shop. Register for free at https://koalanda.pro/signup to explore Koalanda’s competitor research tools.
Sales on Etsy by country in May
This month, the differences between countries are quite pronounced.
| Country | March | April | May |
| United States | 1.27% | 0.75% | 2.04% |
| United Kingdom | 1.60% | -12.55% | 6.65% |
| Canada | -1.84% | -5.34% | -3.56% |
| Germany | 2.38% | -3.45% | 7.15% |
| Australia | -1.11% | -1.68% | -0.96% |
| China | 11.82% | -4.38% | -8.05% |
| Türkiye | -0.68% | -1.31% | 4.85% |
| France | -4.50% | -6.06% | 10.15% |
| Ukraine | 6.05% | -3.63% | 1.03% |
| India | 4.01% | 1.83% | 3.33% |
On one side, we have countries where average daily sales declined compared to the previous month. For Australia and Canada, the drop was relatively minor—1% and 4% respectively. But for China, the decline was more significant, at 8%. Chinese shops also saw a similar dip back in February, followed by an impressive rebound of over 11% in March. Whether we’ll see a similar recovery this time remains to be seen. As for Canadian shops, they’ve now experienced six consecutive months of declining sales.
On the other side, we have a larger group of countries that saw growth. France posted the strongest results, with a 10%+ increase. This is welcome news for French shops, as it’s their first month of growth in average daily sales this year. We can say the same about Turkey, although the growth there was more modest—just under 5%.
Newly opened shops on Etsy in May
In April, 126,753 new shops were opened on Etsy—a 6% increase compared to March. Competition continues to grow at a faster rate than sales.
Top 10 most successful Etsy sellers in May
The 10 shops with the highest number of sales on Etsy in May were:
| Rank | Etsy Shop | Monthly Sales | Country | Category |
|---|---|---|---|---|
| 1 | SilverRainSilver | 37,056 | United Kingdom | Jewelry |
| 2 | SeedGeeks | 31,629 | United States | Home & Living |
| 3 | CaitlynMinimalist | 31,255 | United States | Jewelry |
| 4 | WarungBeads | 30,261 | United States | Craft Supplies & Tools |
| 5 | SeedCult | 26,921 | United States | Home & Living |
| 6 | ArrowGiftCoLtd | 26,236 | United Kingdom | Paper & Party Supplies |
| 7 | TheGreenEscape | 17,818 | United States | Home & Living |
| 8 | MyPorchPrints | 17,169 | United States | Craft Supplies & Tools |
| 9 | SeedTherapy | 16,579 | United States | Home & Living |
| 10 | ImprintedSupplies | 15,068 | United States | Craft Supplies & Tools |
Explore the top-selling and trending Etsy shops for free and without registration with Koalanda. In Koalanda you can browse the most complete catalog of Etsy shops on the internet, updated daily.
Holidays
As we reach the middle of June, it’s already time to start looking ahead to August.
August is generally a quiet month when it comes to major holidays, especially in key Etsy markets like the U.S., Canada, and the UK. With no widely celebrated gifting occasions or seasonal campaigns, it’s not surprising that we don’t expect a significant boost in sales during this time. For many shoppers—and sellers—August is more about taking a break than making purchases. That lull in activity can lead to slower traffic and fewer orders across the platform.So while August may not bring headline-making numbers, it can still be valuable in its own way—a moment of calm before the storm that is Q4. Whether you’re using the time to travel, experiment with new products, or simply breathe, this pause might be exactly what your shop needs before the busier months return.


